
You've successfully created and distributed the survey, and now your respondents opening the survey. How do you make sense of who has vs. hasn't completed the survey? We acknowledge that in the past, its been a little bit confusing about what those survey stats mean, but we've made amends by introducing new changes in a recent release that will bring consistency and clarity.
Let's start off by reviewing some basic definitions
Basic Definitions
We've cleaned up all the statistics across SparkThink, so now the definitions are all the same!
| Name | Description | Collector Types | Screens Displayed |
|---|---|---|---|
| Not Sent | The number of respondents who have not been sent an email | Email Invitation Only | Collector Only |
| Not Started | The number of respondents who have received an email invitation but not started the survey | Email Invitation Only | Collector Only |
| In Progress* | The number of respondents who have started, but have not completed the survey. This is defined by those people who have opened the survey URL (including those who have opened the survey but have not clicked “Let’s Get Started”). | All Collectors | Survey + Collector |
| Completed | The number of respondents who have completed the survey | All Collectors | Survey + Collector |
| Completion Rate | This measures the ability of respondents to complete the survey once they have started the survey. (Number of completed respondents divided by the sum of the completed and in progress respondents) | All Collectors | Survey + Collector |
Here's where those respondent statistics show up:
- Viewing survey collector stats (from the email invitation or survey link screens)
- View survey responses (in the Results screen)
- Viewing respondent progress (for your email invitation or Slalom-only survey link)
Let's take a look at each one of those screens!
1 - Viewing survey collector stats (from your email invitation or survey link)
We've updated the response tracking stats when you view each of the survey collectors (email invitations or survey links) to make it clearer.
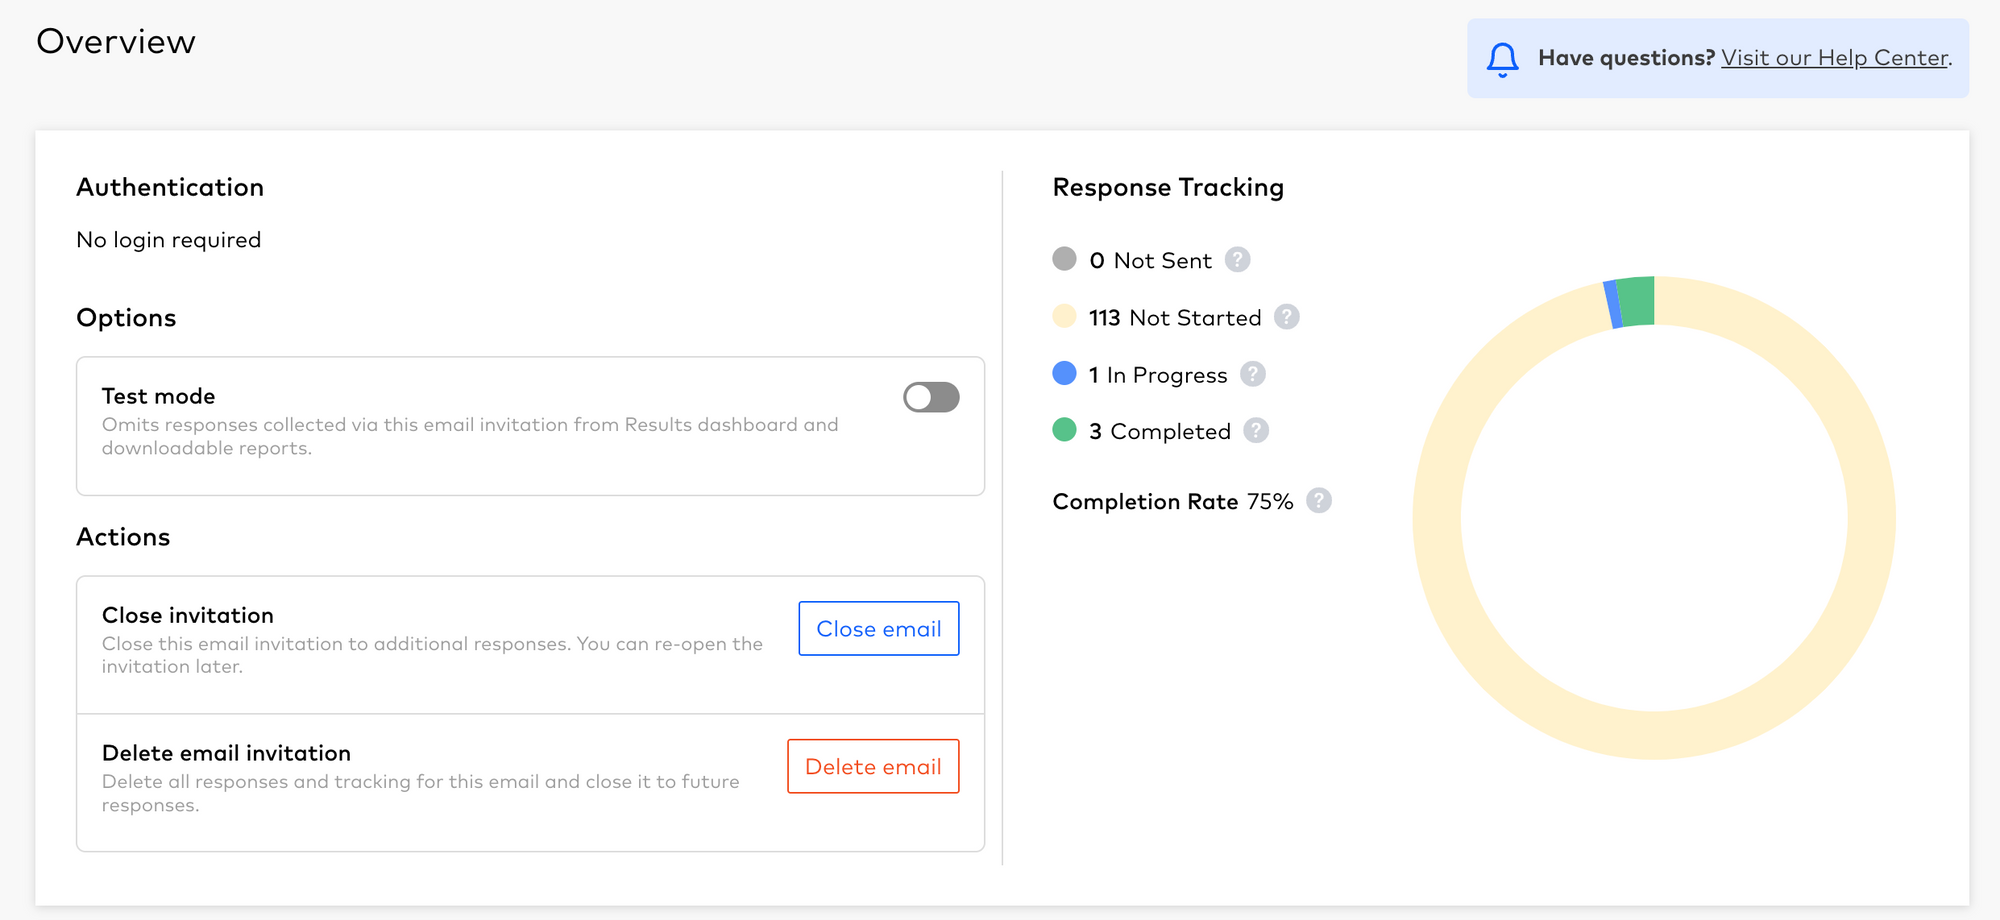
The revised response tracking stats on the right will always show "In Progress", "Completed" and "Completion Rate", no matter what type of survey collector you're currently viewing.
"Not Sent" and "Not Started" will only show when viewing email invitations.
2 - View survey responses (in the Results screen)
We've also updated the stats on the Results screen with data charts that match the data charts in the survey collector screens. In this screen, you will only see "In Progress", "Completed" and "Completion Rate", and these definitions match the definitions used in the survey collector screens.
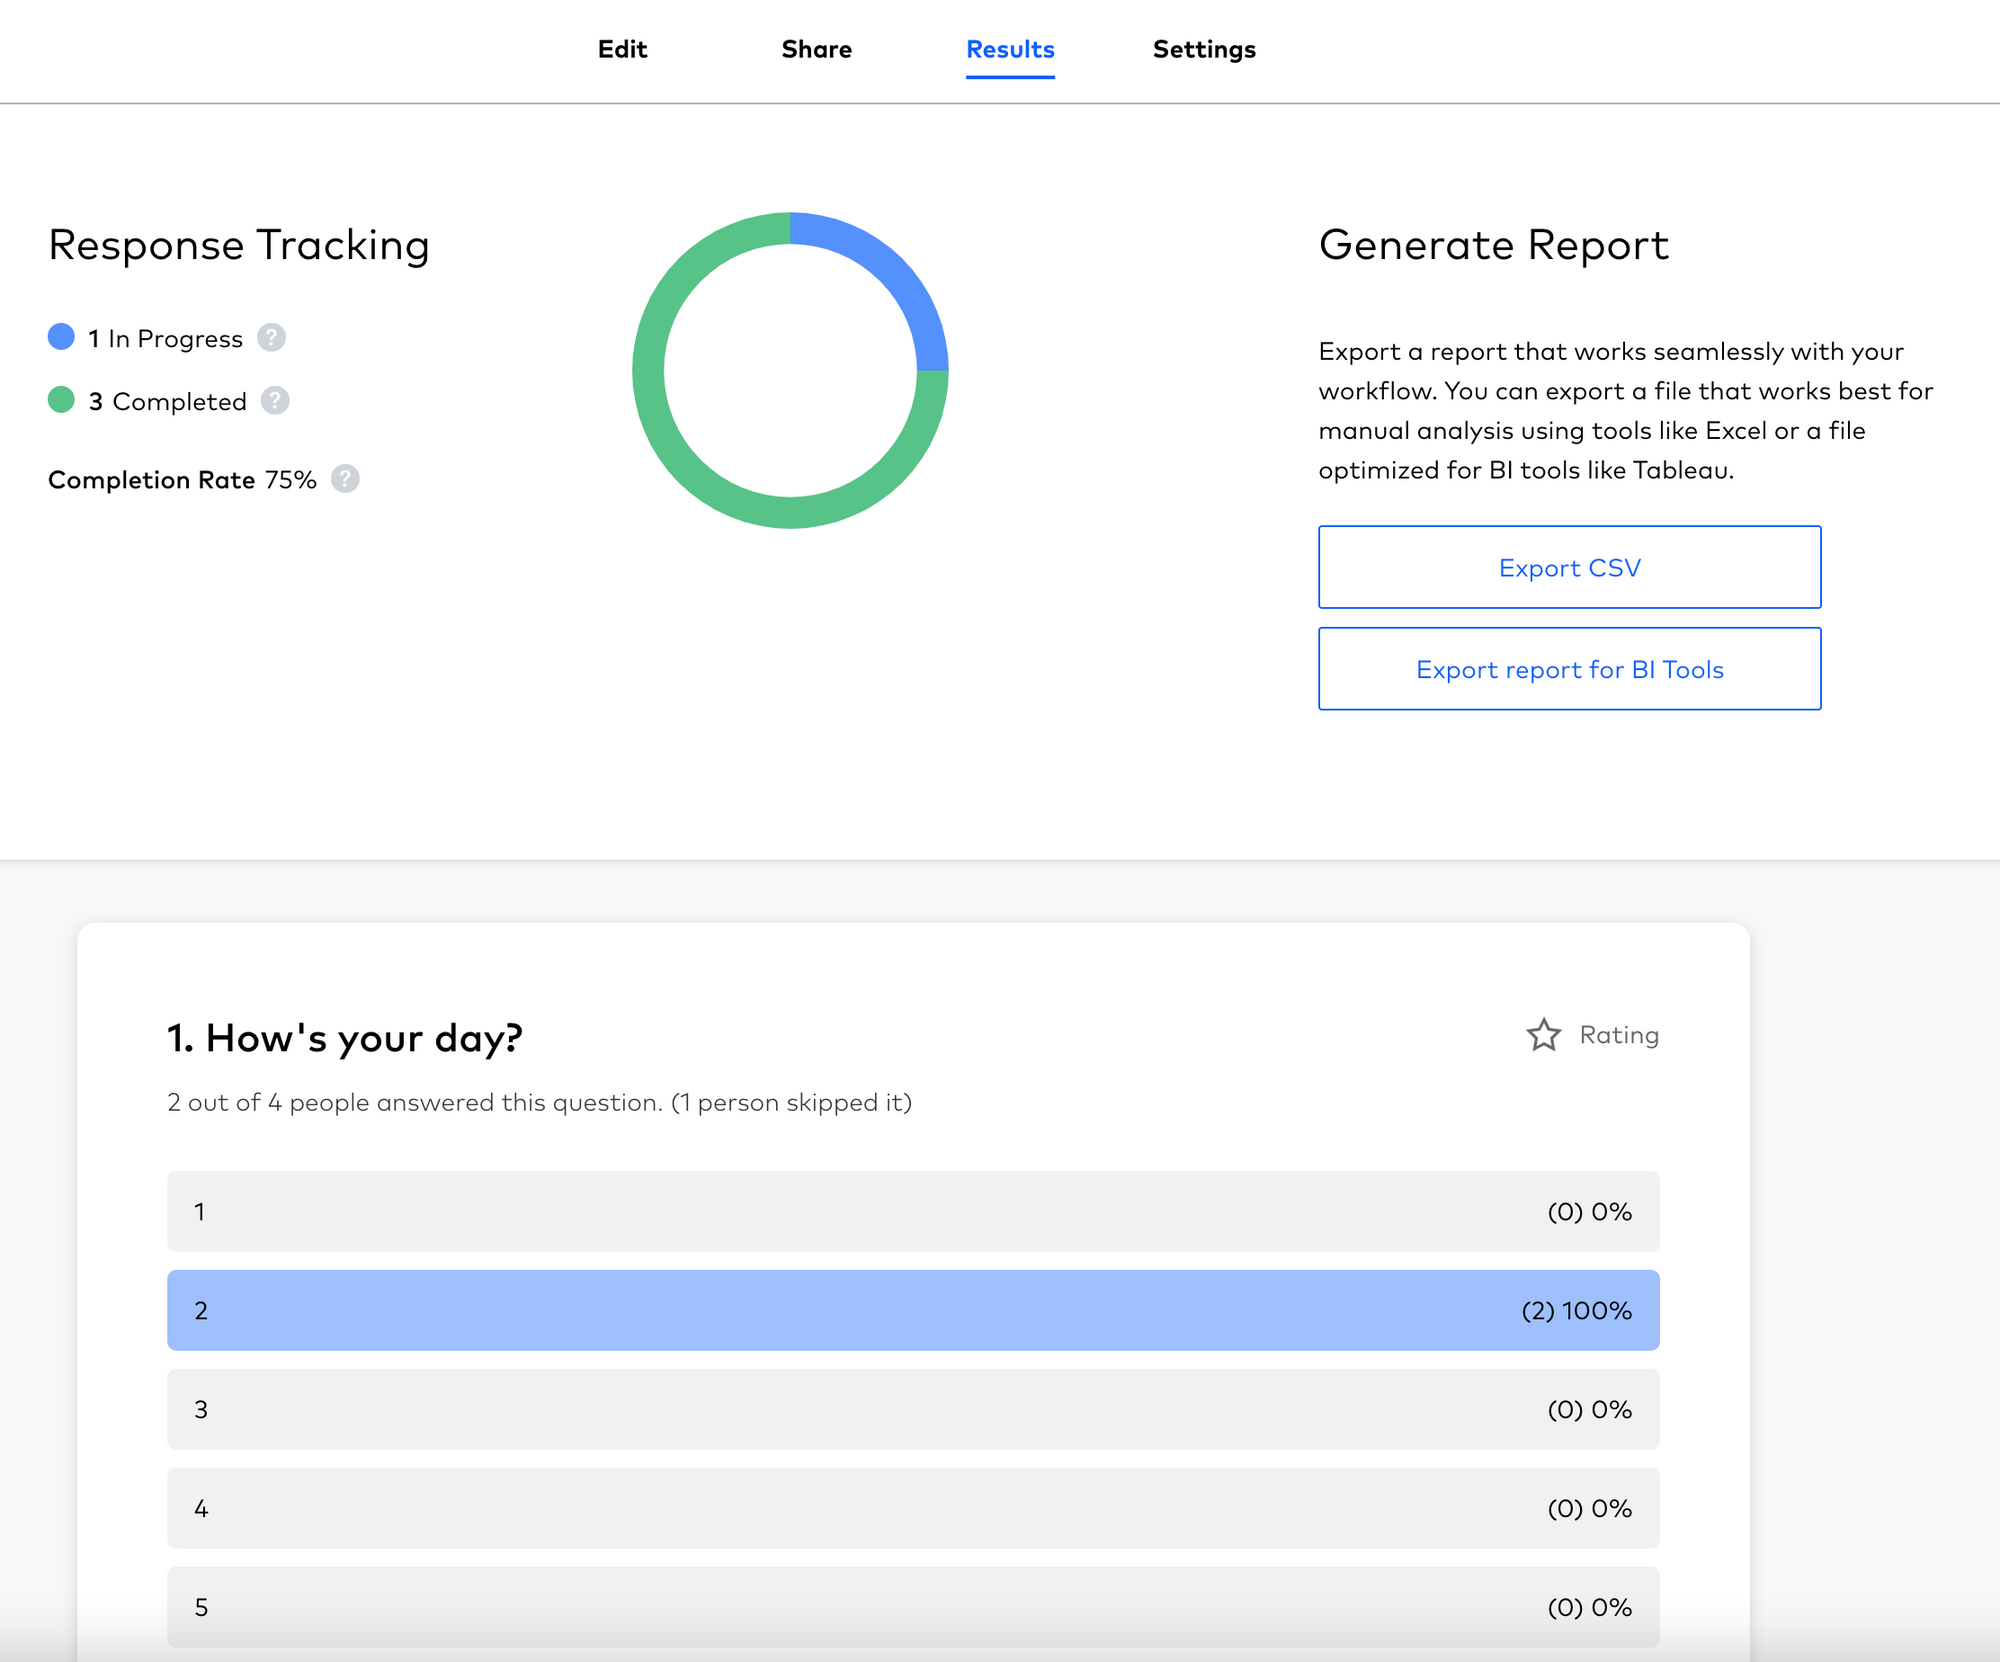
Furthermore, we've made the response stats at the question-level clearer too! Let's use the example above to demonstrate what this means!
"2 out of 4 people answered the question. (1 person skipped it)"
| Example Statistic | Explanation |
|---|---|
| "2 out of 4 people" | 2 represents the number of respondents who have submitted a (non-blank) response to this question. 4 represents the total number of respondents who are in progress or completed the survey |
| "1 person skipped it" | 1 represents the number of respondents who have viewed the question, but skipped it by providing a blank response to the question |
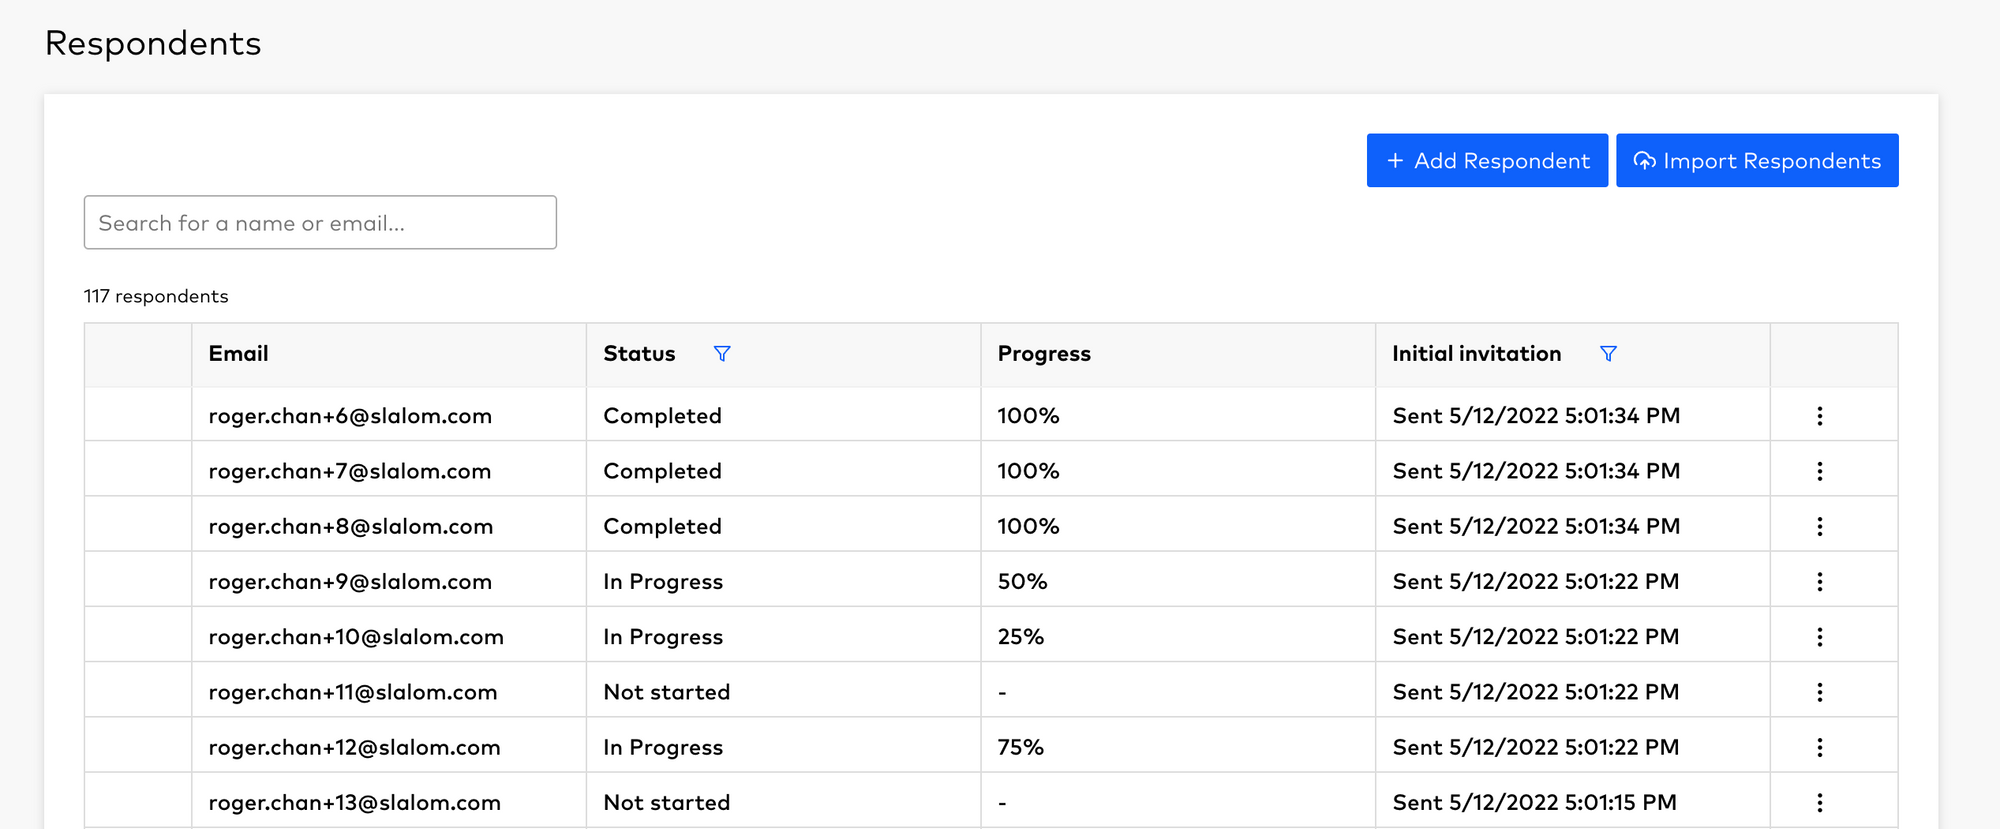
3 - Viewing respondent progress (for your email invitation or Slalom-only survey link)
You can now monitor the survey completion progress of the individual respondent by viewing the "Respondents" table for your email invitation or Slalom-only survey link. This feature allows you to take action on specific respondents depending on their completion progress.
For example, you may send a follow-up email to those folks who completed less than 25% of the survey.
That's all for now! You are now equipped to fully understand and take action on your survey respondents progress.

